
Knowing and telling your story
Whether you are a major brand or researching a cure for cancer we want to help inform your daily decisions. Meltwater has grown to be the leading media monitoring platform collecting all the data around the world about your company or entity and making it actionable. That means Dashboards that make sense, it’s notifications and settings that are effective and don’t drive you crazy, and it’s reports that save you time and avert pain. It’s an experience that makes your life a bit happier.
The goal of Meltwater is to provide you with insights. The Data Science Team ingests over eight billion articles a day and enriches them. Meltwater allows you to use media intelligence to inform strategy, connect with your audience and measure success. Companies and brands can achieve better outcomes through Data.
PROCESS
• Empathize - On all projects we would start with research and reconnecting through interviews and surveys to empathize with our users. Our data science
• Define - That would always help us learn and start to define an open ended statement around the problem we were hoping to solve.
• Ideate - Next came ideating where we’d love to do a design sprint when time and task permitted. Alternative approaches welcome at this stage.

• Prototype - We would create a range of prototypes from low to high fidelity where appropriate. The important part was getting something in front of people to test and get feedback. It’s an experimental phase where we can test the best possible solutions.
• Test - Follow through is key to an iterative process. It’s time to how people are thinking, behaving and feeling about the experience. Alterations and refinements are made to get the deepest understanding of the product and its users as possible.
MELTWATERS CORE OFFERINGS
Search
Search is the core of Meltwater’s Platform. We continuously interview our users and interact with our sales team listening to pitches and pain points. We would track data for our key metrics which provides the insights that leads to continuous iteration, testing and feedback.
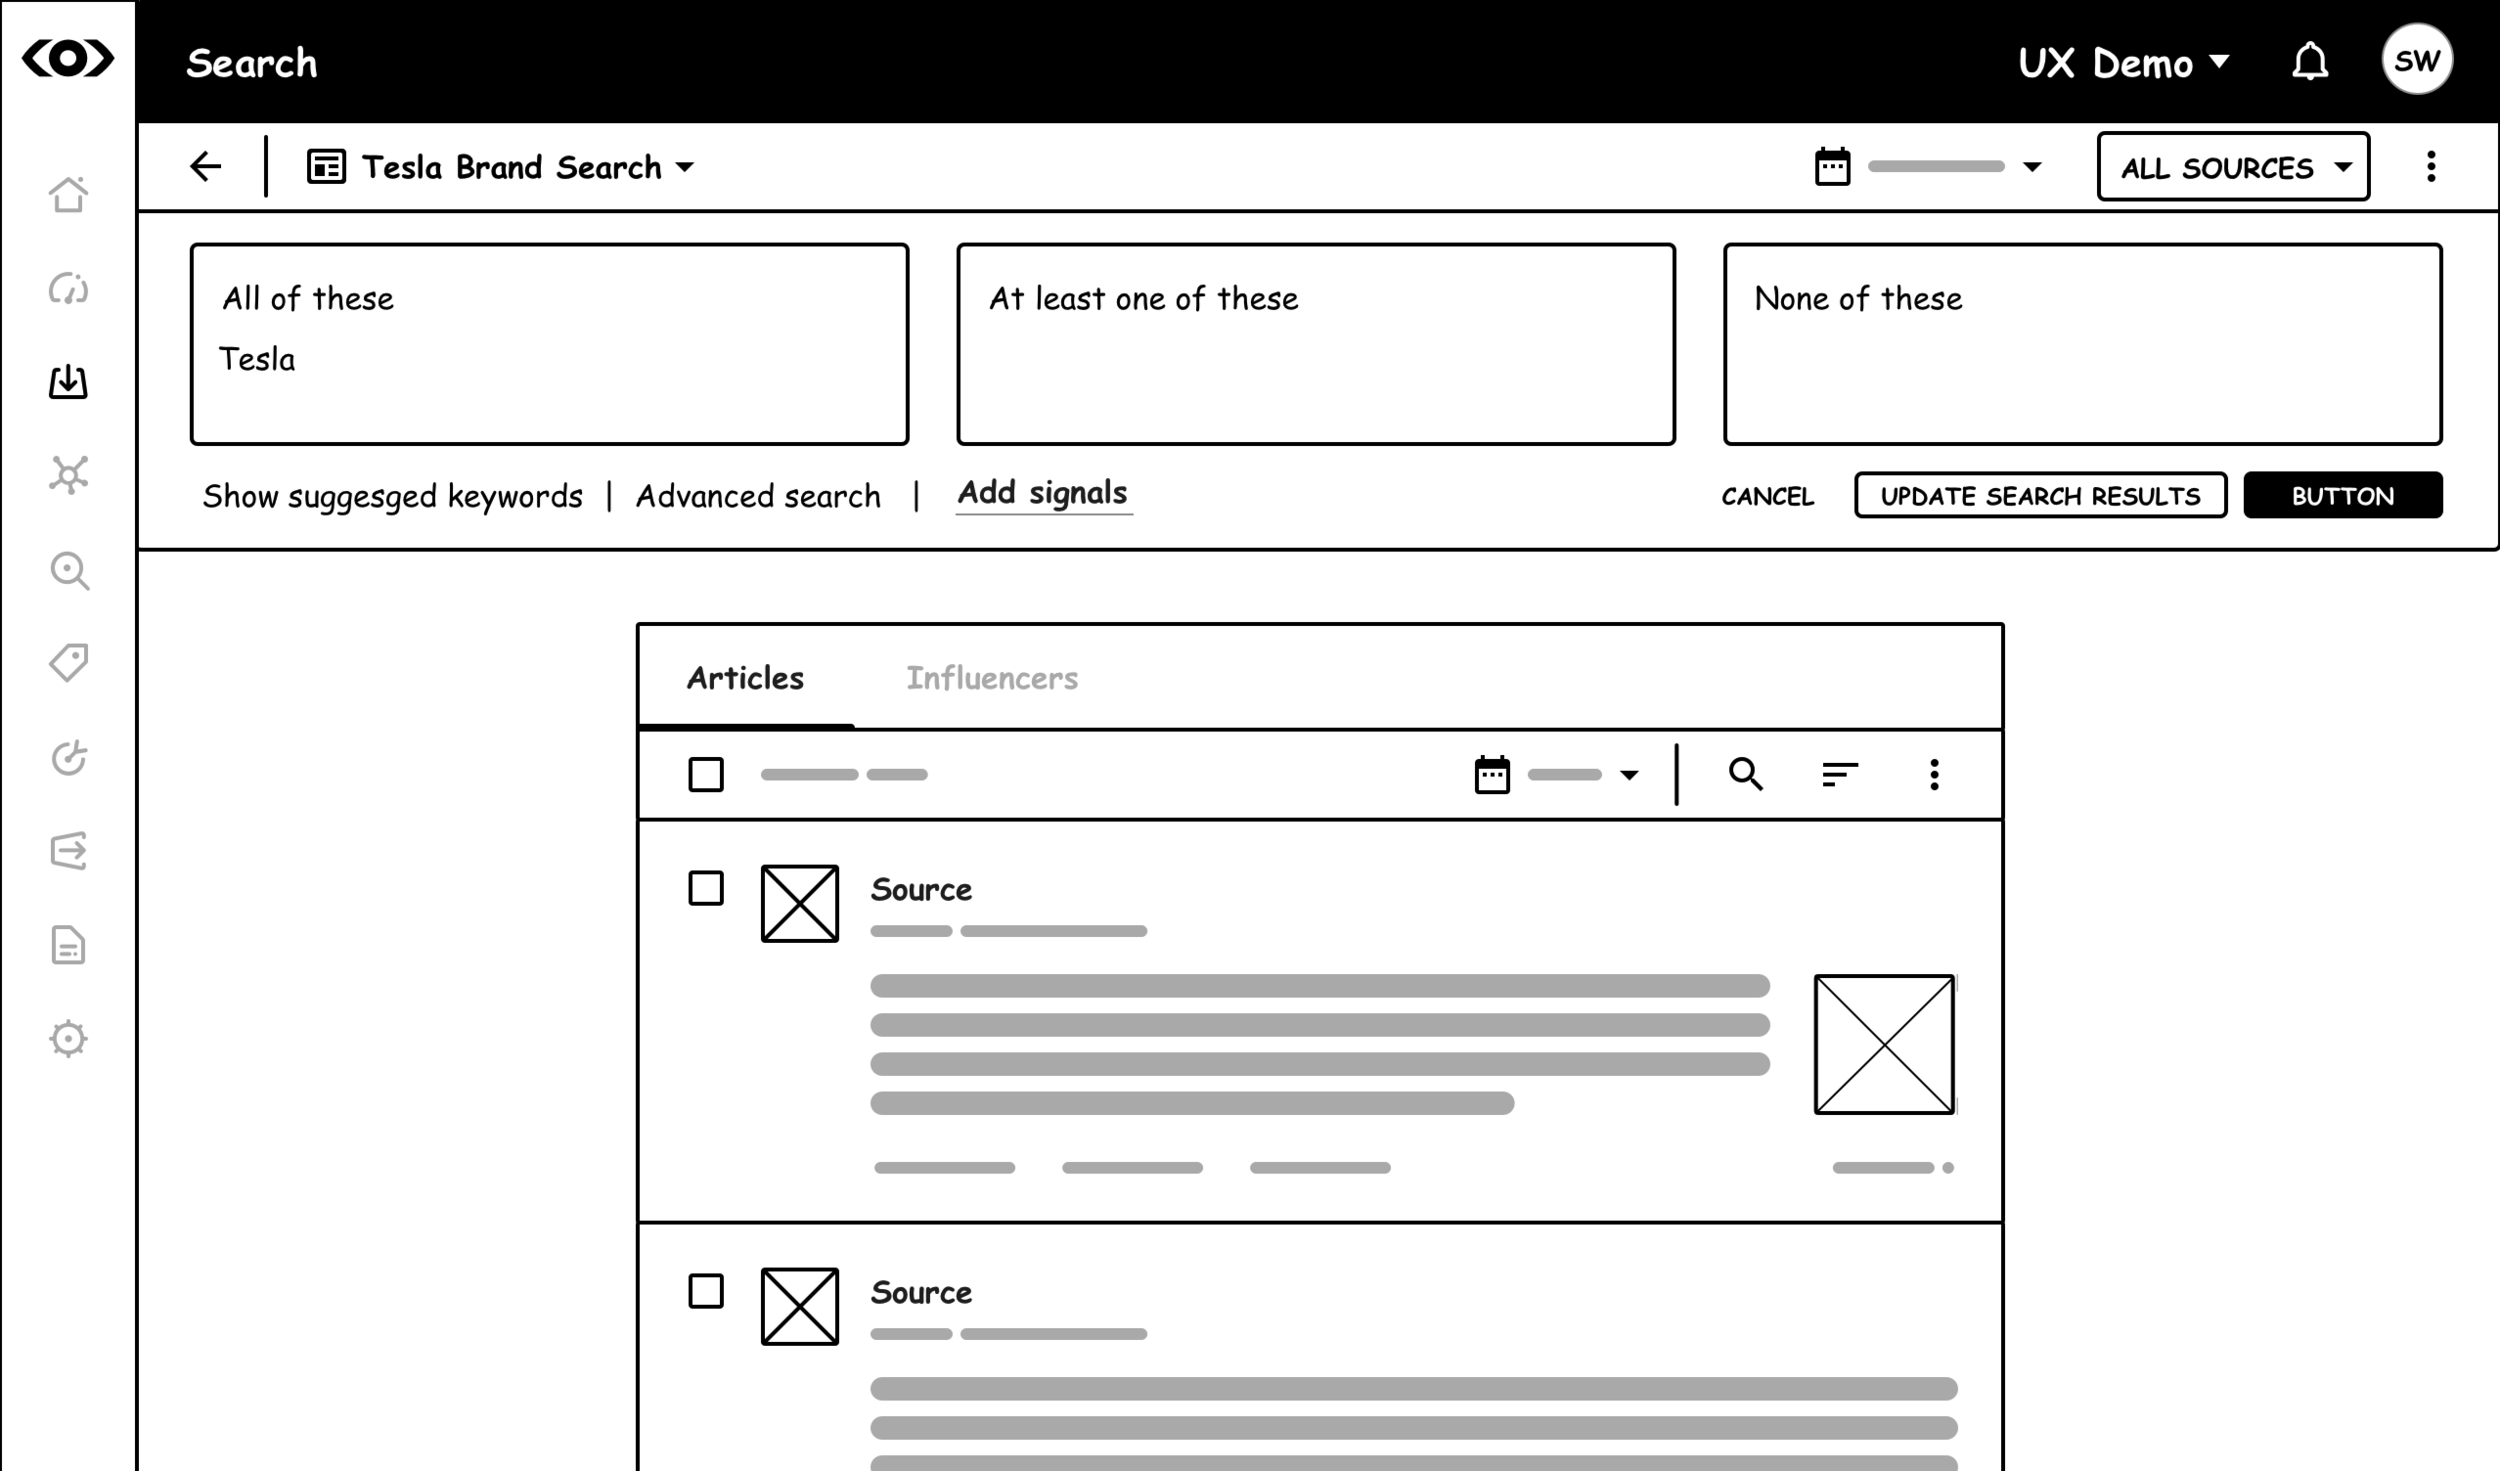
Yes, we experimented with using Comic Sans. It’s been a great way to drive home to the key stake holders that this is a wireframe and focus on the other elements of the experience.
Our UX team worked together refining what we call our FLUX Design System. This included an entire set of visual components for every element of our user experience. We created a set as wireframes which allowed to explore flows and options in a brief amount of time. These can be tested and iterated on quickly.
We also had the high fidelity components. The investment has paid off in the amount of time it saves for the UX team.

Dashboards
Our customers need a way to make sense of the vast amounts of data that we have to offer. We have been researching and refining the types of widgets that are most useful. Here are just a few: The Media Exposure Widget provides insights into how media coverage of a brand, product event or topic is trending over time and can benchmark different sources.The Sentiment Score Widget provides insight into how the general sentiment of a brand, product, event or topic develops over time and at the same time benchmarks this in the context of other brands. We also added widgets for Potential Reach, Share of Voice, Top Languages, Top Locations, Topic Momentum, Heat Maps, Content Streams, Trending Themes, Top Languages, Top Sources and more.

Notifications
We worked with sixteen PM’s across the organization to create notification templates allowing them to roll out custom notifications on their own. The settings and AI component were essential at making this a success. Notificaitons are an art form to engage and bring your customers back without driving them crazy.

Reports
The challenge came along of making a reporting platform that would wow our users, cut production time by 90% and generate $100 million in the first five years. Yes, yes and $15 million in it’s first year. We researched the landscape, listened to our users needs and iterated coming up with a variety of templates all generated by what I titled Keynote in the Cloud.

Stories
Stories was born from a concept of allowing content, time and responses to tell a story in one timeline. We tested several designs. We quickly prototyped and then upon a warm reception continued to iterate the experience into a deliverable appealing product.

Content Streams
We built content streams consisting component cards. This allowed us to go beyond Editorial and Blog content. We've added Youtube, Facebook, Twitter and Instagram.
Mobile
The goal of the iPhone app, android app and mobile web is to increase engagement of our customers. We want a compelling way to get quick glances into what the world is saying. The cards provide a way to quickly scan their feed of content and the graphs give a visual overview of the current trends.


What's Next
At the same time that we are improving the core product, we are also researching and developing the next phase of insights and visualizations powered by big data. Working closely with our team of data scientists we have been exploring the most compelling data to share. Patents filed, job postings and recruiting efforts, and many more areas we are exploring. It's big data and there are insights that will be essential in big decision making of the future. We will look back in disbelief at how little data decision makers had to go on in comparison to what we will be able to provide.